
Traditional dashboards and static reports are no longer enough for making real-time decisions in a business. Decoding insights requires manually skimming through long spreadsheets, and it takes time. But by using AI for data visualization, the whole scenario changes in a positive direction.
AI can detect patterns, generate insights, and draw raw information as dynamic visuals within a few minutes. This technological upgrade is a strategic turning point for decision-makers. It means faster clarity, deeper understanding, and more confident decision-making.
If you want to know how AI-powered data visualization can give your business a competitive edge, this article will guide you through. Discover its advantages, challenges, real-world applications, future trends, and more.
What is AI in Data Visualization, and Why Does It Matter?
AI in data visualization refers to the use of artificial intelligence to automatically analyze data and present insights in a clear, visual format. It takes input and processes it through machine learning, natural language processing, and predictive analytics.
AI-powered data visualization tools can interpret patterns, detect anomalies, forecast trends, and even recommend the best visuals with high accuracy.
Unlike traditional visualization, AI adds an analytical layer over it. Along with data, it shows why it is happening and what’s likely to happen next. Now the dashboard turns into a decision-making engine.
Large enterprises are replacing rigid on-premises stacks with integrated analytics fabrics, while small and mid-sized businesses gain affordable entry through subscription pricing.
And that is why we see huge numbers in the market size. According to Modor Intelligence, the data visualization market size is valued at USD 10.92 billion in 2025 and is forecast to reach USD 18.36 billion by 2030, registering a 10.95% CAGR.
This shift matters now more than ever. Businesses are dealing with massive, dynamic user data coming from multiple platforms, devices, and customer touchpoints. AI can screen them to discover helpful insights faster without any human bias. The faster you can turn raw business data into actionable insights, the quicker your decisions become to improve every aspect of your organization.
Advantages of AI in Data Visualization
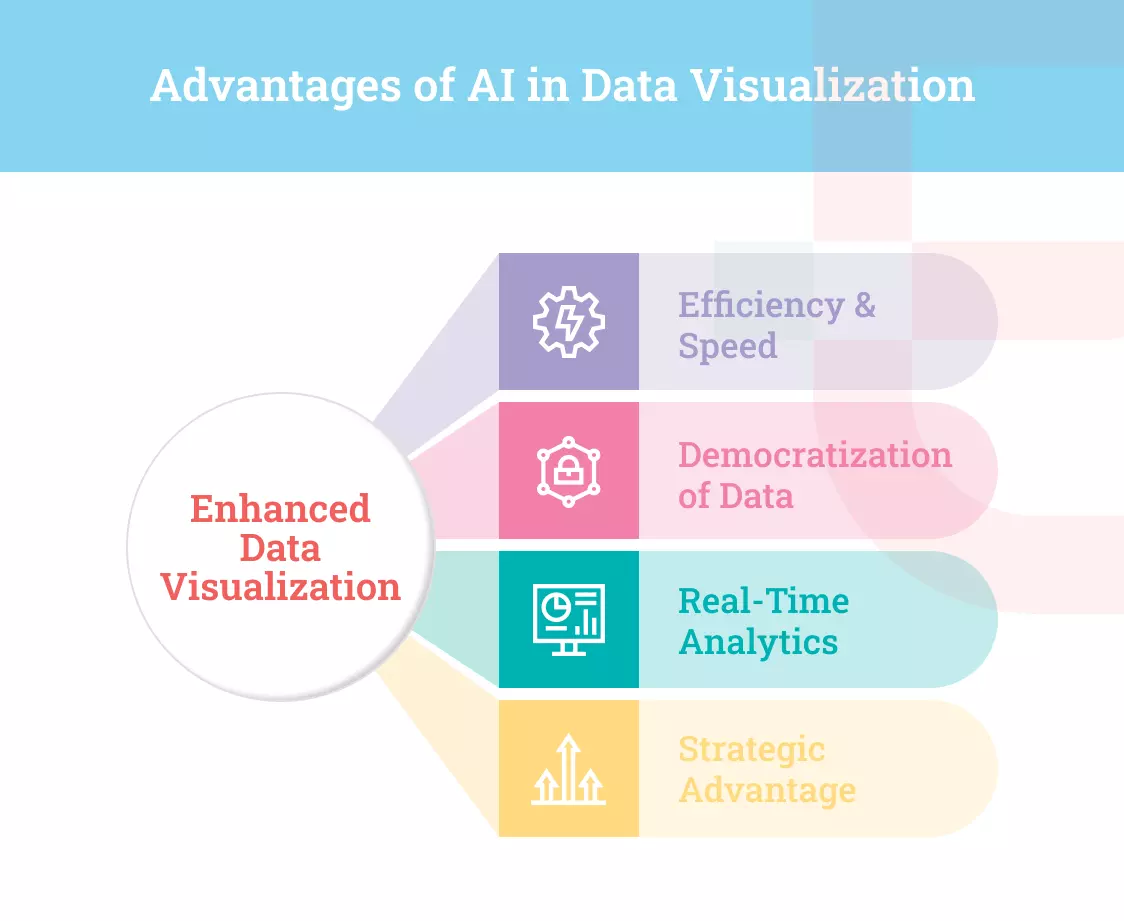
Data visualization tools used to be the domain of a few special people in an organization. But now with AI, anyone can instantly understand the insights without any guesswork. It leads to the following advantages:
Efficiency and Speed
In a traditional setup, first, you have to clean the data of any duplicates before processing and select the right visual formats for the dashboard output. However, AI can process millions of data points within seconds and change the format of visual summaries from charts to bars with a few clicks.
In a SaaS environment, it’s a competitive advantage. The team can process data and get insights on the same day, which could have taken a week with a traditional tool.
Democratization of Data
Unless you’re a data scientist, making use of a traditional data visualization tool is full of guesswork. AI adds natural language processing so that you can talk to the dashboard about the particular insight you want to view.
For instance, the marketing team can use the tool to check campaigns that brought the most trial sign-ups last quarter. Similarly, the sales head can quickly take a note of the accounts with a good upsell potential for a targeted campaign.
Real-time Analytics and Dynamic Visualisation
AI processes your data in real time to help you see what’s happening in the moment instead of waiting for the next day. This feature is extremely helpful in a situation where your user activity or customer interactions evolve minute by minute.
If there are any anomalies, AI instantly flags and dynamically adjusts insights to new changes made by your team. For example, it can automatically highlight sudden spikes in API errors across regions with the root cause. Once DevOps fixes it, the new data is instantly processed and reflected on the dashboard in real time.
Strategic Advantage
When utilized to its full potential, AI helps you get better at risk mitigation and sales forecasting. It can also help you see the exact correlation between product usage patterns and customer lifetime value. In short, it helps you make better product roadmaps with confidence.
The degree of this benefit even amplifies at the executive level. Imagine cracking growth levers for your business by synthesizing data from sales, product, finance, and customer success into a unified view. That’s how AI in data visualization becomes a powerful differentiator in the competitive market.
Want to Leverage the Power of AI in Data Visualization for Your Business? Share Your Requirements with Us.
Applications of AI in Data Visualization
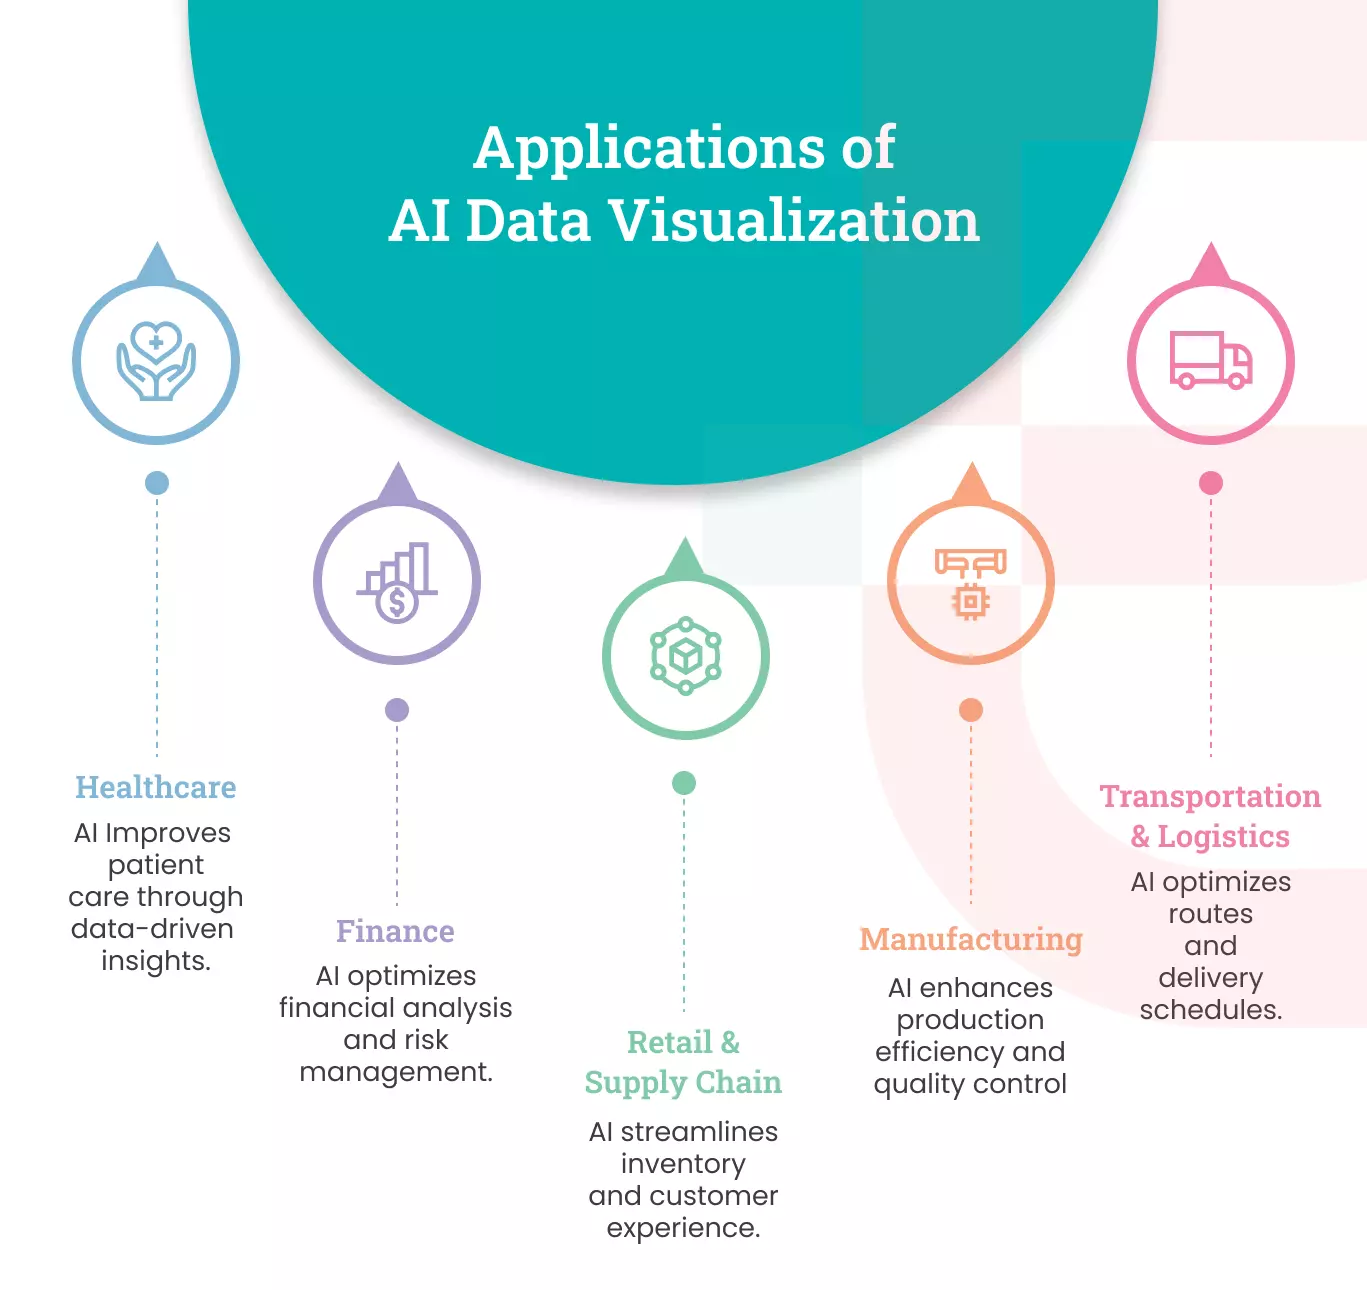
Let’s take a look at some use cases of AI-powered data visualization in different types of industries.
Healthcare
- Patient monitoring dashboards displaying real-time health status by combining EHR data, vitals, and wearables.
- Predicting the chances of disease and its progression through CKD trajectory visualizations
- Infection-prediction dashboards to forecast and avoid infections in hospitals
- Highlighting anomalies in patient data, like sudden vital deviations, to help with prompt actions
Finance
- Visualizing financial fraud with real-time analysis of risk scores, transaction anomaly graphs, and people’s behavior during investigation
- Understanding the relationship between entity, money flow, and suspicious transaction routes
- Risk scoring dashboards using AI-powered explainable models to surface credit or AML risk for customers.
- Risk scoring dashboards to drill down into the credit or anti-money laundering risks faced by customers.
Retail & Supply Chain
- AI-powered predictions in demand-forecasting dashboards to perfectly match inventory with anticipated sales.
- Visualize the best optimized routes to transport items with less fuel consumption and CO₂ emissions
- Digital twin simulations for “what-if” scenarios and a visual representation of the supply chain to plan for unmet needs
- Risk heatmap dashboards showing supplier risks and potential disruptions to raise awareness around weak spots in the supply chain
Manufacturing
- Real-time visualization of machine performance and sensor data to predict equipment failures and reduce downtime.
- AI-driven anomaly detection dashboards that highlight production bottlenecks and quality deviations early.
- Demand forecasting and inventory optimization visuals that help manufacturers balance stock levels and reduce waste.
Transportation and Logistics
- AI-powered route optimization dashboards that visualize traffic patterns, fuel usage, and delivery efficiency in real time.
- Predictive shipment tracking visuals that analyze delays, risks, and ETA accuracy for better supply chain transparency.
- Warehouse operations visualization that uses AI to map picking efficiency, storage utilization, and workforce productivity
Challenges in AI Data Visualization
Unlocking the core powers of data visualization through AI comes with some practical challenges. Let’s understand their reasons and learn how to avoid them in the first place.
Challenge 1: Data Quality and Bias Issues
AI can remove duplicates from the data, but it can not identify if the data has errors, missing values, or biased samples. In that case, the entire visualization processed by AI can be misleading. If those insights flow through multiple sources for decision-making, it can create cascading errors across all touchpoints.
Solution
There should be strong data governance in place. Data should be thoroughly checked for redundancy and anomalies. You can also implement unified data pipelines to reduce data fragmentation. Additionally, adopt a bias detection model, along with human oversight, to review AI’s data interpretation skill over time.
Challenge 2: Over-dependence On AI-generated Insights
An overreliance on AI-generated insights can cloud conscious judgment. It would not be a wise decision to roll out product changes just because AI says so. This can reduce critical thinking and limit creativity in problem-solving.
Solution
Consider AI as your helping hand, not a decision-maker. Every insight it generates should be validated with user research for the trust factor. To avoid this situation in the first place, keep a cross-functional discussion before making major decisions.
Challenge 3: Security and Privacy Concerns
An AI-powered data visualization tool leverages data from all spheres, including sensitive information. It could be customer personal details, financial sheets, and operational logs. In the absence of strong data security protocols, the data may fall into the wrong hands, leading to reputational harm or legal consequences.
Solution:
When using AI for data visualization, consider encrypting data end-to-end with strict access control. Allow role-based permission so that only authorized teams can access sensitive data sheets.
Challenge 4: Cost and Infrastructure Challenges
For startups with limited budgets, AI-powered data visualization is a costly investment. A majority of investment goes into the technical infrastructure. It requires massive storage, scalable data pipelines, and dedicated GPU resources. Plus, there will be an ongoing maintenance costs along with operational charges.
Solution
If you’re just starting with AI, implement it in phases. Instead of deploying AI across all analytics functions at once, focus on touchpoints that offer immediate ROI. For example, use AI for churn prediction visualization and gradually expand to anomaly detection, automated reporting, and other functions.
Try cloud-based AI data visualization tools to save resources on initial investment. However, make sure to partner with an expert to integrate AI into your legacy system without any hiccups.
Future of AI in Data Visualization
The next phase of AI will analyze the data as it flows. In this regard, let’s take a look at some emerging AI trends that fundamentally change how your team will benefit from data visualization.
AI-driven Storytelling Dashboards
As of now, AI has been leveraging NLP to allow users to speak to visualization tools for faster insights generation. Soon, AI will leverage natural language generation (NLG) to make insights more digestible for non-technical users. Insights will be presented in a storytelling mode.
For instance, it can present your user engagement insights in a story format as follows:
“User engagement spiked by 20% after the release of Feature X, but churn remained steady because users from segment Y did not adopt the feature.”
Real-time Visual Analytics and Augmented Analytics
AI-augmented analytics will become the next future of BI and visualization tools. The market is expected to grow from USD 12.8 billion in 2025 to USD 84.3 billion by 2035, with a CAGR of 20.7%. With augmented analysis, businesses can conduct their own analysis without relying on data scientists. This will not only reduce human bias but also speed up the analysis process.
For instance, augmented analytics can scan your customer-success dashboard to spot a particular region that faced a sudden spike in feature usage two weeks ago. This will help you make more informed decisions in the right direction.
Integration with Generative AI for Contextual Insights
According to Gartner, 75% of analytics content will use GenAI for enhanced contextual intelligence by 2027. Generative AI is getting better day by day. With its enhanced skills, visualization tools will produce more contextual and narrative-rich insights.
Instead of just reporting a drop in retention, it will explain the reason behind it and suggest improvements with more context than now. Besides decoding charts, your teams can save time on planning the correct move to improve engagement.
Elluminati: Your Go-to Partner to Build Data Visualization Solutions
AI has changed how businesses read and use data. Static dashboards no longer offer enough clarity. AI-powered visualization delivers faster insights, deeper patterns, and clearer direction. It helps teams move from guesswork to confident decisions. Every business today handles growing volumes of information. AI makes that information meaningful, timely, and actionable.
This is the right moment to explore custom AI solutions built for your goals. A tailored visualization tool gives you control, accuracy, and real strategic value. Consider working with Elluminati for any AI development services to create a system designed around your data and your workflow.
We have expert developers who have expertise in working with various industries to solve their challenges using the best tech solutions. You can reach us for your requirements of data analytics, whether it’s an AI-powered data visualization system or any AI services, we have got you covered with a very solution to your problem.
The future of analytics is intelligent and dynamic. Your business should be ready for it.
FAQs
Small-medium enterprises (SMEs) can either choose a subscription-based platform or build a custom AI analytics infrastructure. Subscription-based models charge somewhere between $50 and $500 per user per month. It takes $15,000 to $150,000 to build a custom AI data visualization tool with ongoing cloud and maintenance costs.
Usually, it takes three to six months to experience ROI from an AI-powered data visualization tool. However, it may vary depending on your use case and data maturity. In the case of SaaS, ROI can be even faster (1-2 months) as insights generated can immediately enhance user engagement.
Yes, modern AI data visualization tools aim to democratize data so that even non-technical teams can leverage all the benefits. That’s why modern tools are powered by NLQ, drag-and-drop dashboards, and storytelling summaries. This will speed up decision cycles across every department.
AI thrives on clean, structured, consistent data. So, for an accurate analysis, the tool requires complete data sourced without duplication or outdated entries. Data definition must remain uniform across all systems. Plus, it should follow predictable schemas for AI to generate a fast response.
The maintenance and ongoing costs of AI visualization dashboards vary between $5000 to $20,000 per month. For SMEs using cloud-based tools, maintenance cost varies depending on their team size and data volume. For enterprises with custom infrastructure, ongoing costs are higher because they include DevOps, data engineering, and AI model maintenance.
Yes, using AI in data visualization may involve risks related to data quality and bias, transparency issues, high operational costs, and an over-reliance on technology that diminishes human expertise. The costs associated with fixing these challenges may increase the investment cap by 15-20% with proper planning, governance, and cost monitoring.